Visualize Data: See What Crops Area Farmers are Planting

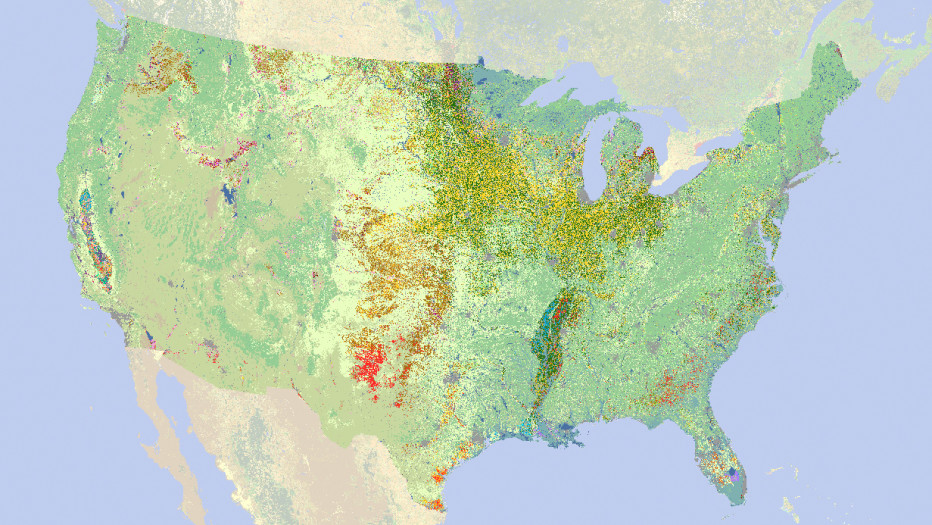
There’s nothing more difficult to interpret than a huge data set. Conversely, when a huge data set is represented visually in a user-friendly tool, sometimes the most mundane information becomes fun to explore. Such is the case here where the type of crop planted in a particular field is plotted to a map of the U.S.

Zoom and scroll your way to learning where our food is produced. Check out the database here.

Josh Wolsky

Developer & Writer @TheMinot Voice, Fan of the Souris River, SavorMinot Advocate. Fortunate to be a 'former' City Council member ;)

Local Businesses Supporting Local News

Want a Daily Minot Update?

Hidden
Name
This field is for validation purposes and should be left unchanged.

Leave a Reply

Your email address will not be published. Required fields are marked *